
ꯐꯥꯏꯜ:IQ curve.svg

Size of this PNG preview of this SVG file: ৬০০ × ৪৮০ ꯄꯤꯛꯆꯦꯜꯁ. ꯑꯇꯩ ꯁꯦꯡꯅ ꯌꯦꯡꯕ ꯌꯥꯕ: ৩০০ × ২৪০ ꯄꯤꯛꯆꯦꯜꯁ | ৯৬০ × ৭৬৮ ꯄꯤꯛꯆꯦꯜꯁ | ১,২৮০ × ১,০২৪ ꯄꯤꯛꯆꯦꯜꯁ | ২,৫৬০ × ২,০৪৮ ꯄꯤꯛꯆꯦꯜꯁ.
ꯐꯥꯏꯜ ꯑꯁꯦꯡꯕ (ꯑꯦꯁ•ꯚꯤ•ꯖꯤ ꯐꯥꯏꯜ, ꯌꯥꯝꯗꯅ ৬০০ × ৪৮০ ꯄꯤꯛꯆꯦꯜ, ꯐꯥꯏꯜ ꯆꯥꯎꯕꯒꯤ ꯆꯥꯡ: ৯ KB)
ꯑꯇꯦꯟꯕꯥ ꯁꯟꯗꯣꯛꯅꯥ ꯇꯥꯛꯄꯥ
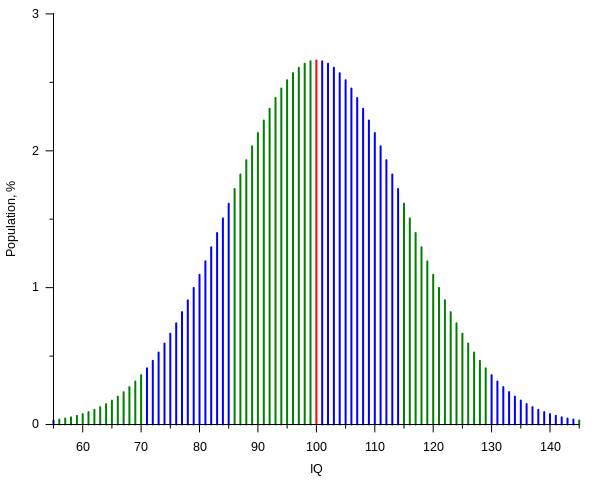
| ꯁꯟꯗꯣꯛꯅꯥ ꯇꯥꯛꯄꯥ | Current IQ tests typically have standard scores such that the mean score is 100 with each standard deviation from the mean counting for 15 IQ points.[1] The plot shows, assuming that such scores have a normal distribution, the percentage of people getting a score versus the score itself, from 55 to 145 IQ, that is over a span of six standard deviations. Spans are represented with different colors for each standard deviation above or below the mean. The plot was created with the following gnuplot code: |
| SVG genesis | |
| Source code | Gnuplot codeset terminal svg name 'IQ_curve' size 600,480 font ',10' rounded
set output 'IQ_curve.svg'
mu = 100.0
sigma = 15.0
from = 55
to = 145
# Normal distribution:
# (continuos normalization approximation, good to ~10 digits in this case)
P(x) = exp(-(x - mu)**2 / (2 * sigma**2)) / (sqrt(2 * pi) * sigma) * 100
# By sigma intervals:
oddsi(x) = (int(abs(x - mu) / sigma) % 2) ^ (x < mu)
Pm(x) = (x == mu) ? P(x) : 1/0 # sample at mu
Po(x) = ( oddsi(x) && (x != mu)) ? P(x) : 1/0 # samples in odd sigma intervals
Pe(x) = (!oddsi(x) && (x != mu)) ? P(x) : 1/0 # samples in even sigma intervals
set key off
set border 3
set xlabel 'IQ'
set xtics 10 out nomirror
set mxtics 2
set ylabel 'Population, %'
set ytics 1 out nomirror
set mytics 2
set samples (to - from + 1)
set style function impulses
plot [x = from:to] \
Pm(x) lw 2, \
Po(x) lw 2, \
Pe(x) lw 2
|
| ꯆꯩꯆꯠ | |
| ꯍꯧꯔꯛꯐꯛ | ꯏꯁꯥ ꯏꯊꯟꯇꯒꯤ ꯑꯣꯏꯕꯥ ꯊꯕꯛ |
| ꯄꯨꯊꯣꯛꯂꯤꯕ ꯃꯤ | Alessio Damato, Mikhail Ryazanov |
- ↑ Kaufman, A.S. (꯲꯰꯰꯹) IQ Testing 101, New York (NY): Springer Publishing, pp. 104−109 ISBN: 978-0-8261-0629-2.
ꯑꯌꯥꯕꯥ
I, the copyright holder of this work, hereby publish it under the following licenses:

|
ꯁꯤꯟꯗꯣꯛꯅꯕ ꯑꯌꯥꯕꯗꯨ ꯄꯤꯔꯦ, ꯌꯦꯟꯊꯣꯛꯎ ꯑꯃꯁꯨꯡ/ꯅꯠꯇ꯭ꯔꯒ ꯃꯑꯣꯡ ꯱ꯗ ꯁꯦꯝꯗꯣꯛꯎ ꯃꯁꯤꯒꯤ ꯐꯥꯏꯜ ꯑꯁꯤ ꯖꯤ•ꯑꯦꯟ•ꯌꯨ ꯃꯃꯜ ꯇꯤꯡꯗꯕ ꯗꯣꯀꯨꯃꯦꯟꯇꯦꯁꯟꯒꯤ ꯑꯌꯥꯕ ꯌꯥꯅꯕꯒꯤ ꯃꯈꯥꯗ, ꯚꯔꯖꯟ ꯱.꯲ ꯅꯠꯇ꯭ꯔꯒ ꯇꯨꯡꯗ ꯂꯥꯛꯀꯗꯕ ꯚꯔꯖꯟ Free Software Foundationꯅ ꯐꯣꯡꯗꯣꯛꯂꯕ; ꯂꯣꯏꯅꯅ ꯈꯦꯠꯅꯕ ꯁꯔꯨꯛꯁꯤꯡ ꯌꯥꯎꯗꯅ, ꯂꯥꯏꯔꯤꯛꯀꯤ ꯃꯃꯥꯡꯒꯤ ꯃꯈꯨꯝ ꯌꯥꯎꯗꯕꯤ, ꯑꯃꯗꯤ ꯂꯥꯏꯔꯤꯛꯀꯤ ꯑꯔꯣꯏꯕ ꯆꯦꯈꯨꯝ ꯌꯥꯎꯗꯕꯤ ꯫ ꯁꯤꯟꯗꯣꯛꯄ ꯌꯥꯕꯒꯤ ꯑꯌꯥꯕꯁꯤꯡꯁꯤ GNU Free Documentation Licenseꯒꯤ ꯁ꯭ꯔꯨꯛꯁꯤꯡꯗ ꯌꯥꯎꯔꯦ ꯫ |
| ꯐꯥꯏꯜ ꯑꯁꯤ ꯀ꯭ꯔꯤꯌꯦꯇꯤꯚ ꯀꯣꯃꯣꯟꯁꯀꯤ Attribution-Share Alike 3.0 Unported ꯑꯌꯥꯕꯒꯤ ꯃꯈꯥꯗ ꯌꯥꯎꯕꯅꯤ ꯫ | ||
ꯃꯈꯥꯗ ꯎꯠꯀꯗꯕꯅꯤ ꯑꯁꯦꯡꯕ ꯑꯅꯧꯕ ꯱ ꯑꯣꯏꯅ ꯂꯧꯗꯨꯅ ꯫ | ||
| This licensing tag was added to this file as part of the GFDL licensing update. |
This file is licensed under the Creative Commons Attribution-Share Alike 2.5 Generic, 2.0 Generic and 1.0 Generic license.
- ꯅꯪꯒꯤ ꯀꯨꯁꯤ:
- ꯃꯌꯥꯝꯗꯥ ꯐꯪꯍꯟꯕꯥ – ꯊꯥꯕꯛ ꯑꯗꯨ ꯁꯤꯟꯖꯤꯟꯕꯥ, ꯌꯦꯟꯊꯣꯛ ꯎ ꯑꯃꯥꯗꯤ ꯃꯐꯝ ꯱ ꯗꯥ ꯆꯠꯍꯟꯂꯨ
- ꯑꯃꯨꯛꯀꯥ ꯌꯥꯟꯁꯤꯟꯅꯍꯟꯕꯥ – ꯊꯥꯕꯛꯇꯨꯒꯥ ꯆꯨꯁꯤꯟꯅꯍꯟꯕꯥ
- ꯃꯈꯥꯒꯤ ꯌꯥꯅꯕꯒꯤ ꯃꯈꯥ ꯄꯣꯟꯅ:
- ꯈꯣꯝꯒꯠꯂꯛꯄꯥ – ꯅꯪꯅ ꯆꯞꯆꯥꯕ ꯇꯧꯕꯤꯃꯜ ꯄꯤꯕꯤꯒꯗꯕꯅꯤ, ꯑꯌꯥꯕ ꯄꯤꯔꯤꯕꯁꯤꯡꯒ ꯁꯝꯅꯐꯝ ꯄꯤꯒꯗꯕꯅꯤ ꯑꯃꯁꯨꯡ ꯑꯍꯣꯡꯕ ꯈꯔꯥ ꯂꯩꯔꯗꯤ ꯃꯗꯨ ꯎꯠꯀꯗꯕꯅꯤ ꯫ ꯅꯪꯅ ꯃꯗꯨ ꯃꯔꯝ ꯂꯩꯅ ꯇꯧꯒꯗꯕꯅꯤ, ꯑꯗꯨꯕꯨ ꯑꯌꯥꯕ ꯄꯥꯏꯔꯤꯕꯗꯨꯅ ꯍꯥꯏꯔꯛꯄ ꯃꯑꯣꯡ ꯅꯠꯇ꯭ꯔꯒ ꯅꯪꯅ ꯁꯤꯖꯤꯟꯅꯕ ꯃꯑꯣꯡꯗ ꯇꯧꯔꯣꯏꯗꯕꯅꯤ ꯫
- ꯃꯥꯟꯅꯕꯥ ꯁꯥꯔꯨꯛ – ꯀꯔꯤꯒꯨꯝꯅ ꯅꯪꯅ ꯌꯥꯟꯁꯤꯟꯅꯔꯕ, ꯍꯣꯡꯗꯣꯛꯍꯟꯂꯕ, ꯅꯠꯇ꯭ꯔꯒ ꯄꯣꯠꯆꯪꯁꯤꯡ ꯁꯥꯒꯠꯂꯕꯗꯤ, ꯅꯪꯒꯤ ꯍꯣꯠꯅꯖꯃꯟ ꯑꯗꯨ ꯃꯁꯤꯒꯤ same or compatible licenseꯒꯤ
ꯅꯪ ꯅꯁꯥꯅꯥ ꯃꯁꯤꯒꯤ ꯑꯌꯥꯕꯁꯤ ꯈꯟꯕꯥ ꯌꯥꯅꯤ ꯫
ꯐꯥꯏꯜꯒꯤ ꯄꯨꯋꯥꯔꯤ
ꯆꯩꯆꯠ/ꯃꯇꯝꯗ ꯅꯝꯃꯨ ꯃꯇꯝ ꯑꯗꯨꯗ ꯐꯥꯏꯜ ꯑꯗꯨ ꯎꯅꯕ
| ꯆꯩꯆꯠ/ꯃꯇꯝ | ꯈꯨꯠꯄꯤꯈꯨꯖꯤꯟ | ꯄꯥꯛ ꯆꯥꯎꯕꯥ | ꯁꯤꯖꯤꯟꯅꯔꯤꯕ | ꯑꯄꯥꯝꯕ ꯐꯣꯡꯗꯣꯛ ꯎ | |
|---|---|---|---|---|---|
| ꯍꯧꯖꯤꯛꯀꯤ | ꯰꯴:꯴꯱, ꯲꯷ ꯅꯣꯚꯦꯝꯕꯔ ꯲꯰꯲꯰ | | ৬০০ × ৪৮০ (৯ KB) | Paranaja | Reverted to version as of 21:27, 2 November 2012 (UTC) |
| ꯰꯲:꯵꯷, ꯳ ꯅꯣꯚꯦꯝꯕꯔ ꯲꯰꯱꯲ |  | ৬০০ × ৪৮০ (৯ KB) | Mikhail Ryazanov | IQ values are now integers; gnuplot-only approach | |
| ꯱꯴:꯵꯰, ꯶ ꯗꯤꯁꯦꯝꯕꯔ ꯲꯰꯰꯶ |  | ৬০০ × ৪৮০ (১২ KB) | Alejo2083 | {{Information |Description= The IQ test is made so that most of the people will score 100 and the distribution will have the shape of a Gaussian function, with a standard deviation of 15. The plot shows the percentage of people getting a score versus the |
ꯐꯥꯏꯜꯒꯤ ꯁꯤꯖꯤꯟꯅꯐꯝ
ꯃꯁꯤꯒꯤ ꯐꯥꯏꯜ ꯁꯤ ꯁꯤꯖꯤꯟꯅꯕ ꯂꯃꯥꯏꯁꯤꯡ ꯂꯩꯇꯦ ꯫
ꯃꯥꯂꯦꯝꯒꯤ ꯊꯥꯛꯇꯥ ꯁꯤꯖꯤꯟꯅꯕꯥ ꯐꯥꯏꯜ
ꯃꯁꯤꯒꯤ ꯐꯥꯏꯜ ꯑꯁꯤ ꯃꯈꯥꯒꯤ ꯑꯇꯩ ꯋꯤꯀꯤꯁꯤꯡꯅ ꯁꯤꯖꯤꯟꯅꯩ:
- ar.wikipedia.org ꯗꯥ ꯁꯤꯖꯤꯟꯅꯩ
- ast.wikipedia.org ꯗꯥ ꯁꯤꯖꯤꯟꯅꯩ
- az.wikipedia.org ꯗꯥ ꯁꯤꯖꯤꯟꯅꯩ
- ba.wikipedia.org ꯗꯥ ꯁꯤꯖꯤꯟꯅꯩ
- be-tarask.wikipedia.org ꯗꯥ ꯁꯤꯖꯤꯟꯅꯩ
- be.wikipedia.org ꯗꯥ ꯁꯤꯖꯤꯟꯅꯩ
- ca.wikipedia.org ꯗꯥ ꯁꯤꯖꯤꯟꯅꯩ
- cs.wikipedia.org ꯗꯥ ꯁꯤꯖꯤꯟꯅꯩ
- da.wikipedia.org ꯗꯥ ꯁꯤꯖꯤꯟꯅꯩ
- de.wikipedia.org ꯗꯥ ꯁꯤꯖꯤꯟꯅꯩ
- Intelligenzquotient
- Normwert
- Wikipedia:WikiProjekt Psychologie/Archiv
- Benutzer:SonniWP/Hochbegabung
- Kritik am Intelligenzbegriff
- The Bell Curve
- Benutzer:Rainbowfish/Bilder
- Quantitative Psychologie
- Intelligenzprofil
- Benutzer:LauM Architektur/Babel
- Benutzer:LauM Architektur/Babel/Überdurchschnittlicher IQ
- de.wikibooks.org ꯗꯥ ꯁꯤꯖꯤꯟꯅꯩ
- Elementarwissen medizinische Psychologie und medizinische Soziologie: Theoretisch-psychologische Grundlagen
- Elementarwissen medizinische Psychologie und medizinische Soziologie/ Druckversion
- Elementarwissen medizinische Psychologie und medizinische Soziologie/ Test
- Benutzer:OnkelDagobert:Wikilinks:Psychologie
- de.wikiversity.org ꯗꯥ ꯁꯤꯖꯤꯟꯅꯩ
- en.wikipedia.org ꯗꯥ ꯁꯤꯖꯤꯟꯅꯩ
- User:Michael Hardy
- User:Robinh
- User:Itsnotvalid
- User:M.e
- User:Quandaryus
- User:Astronouth7303
- User:Mattman723
- User:Iothiania
- User:Octalc0de
- Portal:Mathematics/Featured picture archive
- User:Dirknachbar
- User talk:BlaiseFEgan
- User:Albatross2147
- User:Klortho
- User:Kvasir
- User:Spellcheck
- User:Heptadecagram
- User:Patrick1982
- User:NeonMerlin/boxes
- User:Cswrye
ꯌꯦꯡꯉꯨ ꯃꯂꯦꯝꯒꯤ ꯊꯥꯛꯀꯤ ꯁꯤꯖꯤꯟꯅꯐꯝ ꯑꯗꯨ ꯃꯁꯤꯒꯤ ꯐꯥꯏꯜꯁꯤꯗ ꯫